Just another Frontier

「scipy」タグがついた投稿

Building NumPy and SciPy with GotoBLAS2

NumPyとSciPyをGotoBLAS2を使ってbuildした時のメモ。ここの通りにやっても出来なかったのでいろいろ試行錯誤した残骸。環境は以下の通り。

  • Linux MInt 12 32bit (Ubuntu 11.10ベース)
  • Core2 Quad
  • gcc-4.6

ちなみに私は共有ライブラリだけでやっていますのでstaticライブラリも欲しい人は適当に修正してください。
また、事前に/usr/local/libにLD_LIBRARY_PATHを通しておいてください。 ldconfigも適宜実行。

2012-Feb-27 修正
* NumPyのsite.cfgの表記を修正
* LAPACKのbuildを修正

2012-Mar-26
* 誤字を修正
* LAPACKのbuildを修正

GotoBLAS2

Ubuntu 11.10以降からはOpenBLASというパッケージが配布されています。それを入れるのが一番早いですが、一応ここは手でbuild!!

  1. SurviveGotoBLAS2をここから入手。解凍してMakefile.ruleを編集。以下をコメントイン。
    * TARGET = CORE2 (TARGETの一覧は付属の01.Readme.txtにある。
    * BINARY=32 (32bit)
    * USE_THREAD = 1 (threadを使う)
    * USE_OPENMP = 1 (OpenMPを使う)
    * NUM_THREADS = 4 (最大4threadsまで)
    * NO_CBLAS = 1 (CBLASは自分でbuildする)
    * NO_LAPACK = 1 (LAPACKも自分でry)
  2. $make all -j 4
  3. 念のために共有ライブラリを作りなおす。(ソースはstackoverflow)
    $mkdir temp
    $cd temp
    $cp ../libgoto2.a
    $ar -x libgoto2.a (staticライブラリを.oファイルにばらす)
    $gfortran -shared -lpthread -lgomp  -o libgoto2.so *.o (共有ライブラリを作成)
    $sudo cp libgoto2.so /usr/local/lib
  4. (重要) atlasにリネームしておく。 numpyのbuildの時に必要
    $cd /usr/local/lib
    $sudo ln -s libgoto2.so libatlas.so
    $sudo ln -s libatlas.so libf77blas.so
    $sudo ln -s libf77blas.so libptf77blas.so

CBLAS

  1. CBLASをNetlibから取ってきて解凍。
  2. cp Makefile.LINUX Makefile.in
  3. Makefile.inのCFLAGSとFFLAGSに”-fPIC”を足しておく
  4. $make all -j 4, これでlibにcblas_LINUX.aができている.
  5. .oファイルから共有ライブラリを作る
    $ gfortran -shared src/*.o  -o libcblas.so
  6. ライブラリディレクトリにコピー&リンクの作成
    $sudo cp libcblas.so /usr/local/lib
    $cd /usr/local/lib
    $sudo ln -s libcblas.so libptcblas.so

LAPACK

  1. LAPACKをNetlibから取ってきて解凍。
  2. $cp make.inc.example make.inc
    (optional) make.incの”-O2″を”-O3″に変更。
    make.incかSRC/Makefileに”-fPIC”をつけておく。
    $make lapacklib -j 4 (テストは面倒なので飛ばします。ちゃんとやりたい人はallで)
  3. 共有ライブラリを作成
    $mkdir temp
    $cd temp
    $cp ../liblapack.a .
    $ar -x liblapack.a (staticライブラリをばらす)
    $gfortran -shared -o liblapack.so *.o
  4. ライブラリディレクトリにコピー
    $sudo cp liblapack.so /usr/local/lib

NumPy

  1. NumPyのソースを公式サイトからダウンロードして解凍
  2. $cp site.cfg.example site.cfg
  3. site.cfgを編集
    [DEFAULT]
    library_dirs = /usr/local/lib
    include_dirs = /usr/local/include[blas_opt]
    libraries = ptf77blas, ptcblas, atlas[lapack_opt]
    libraries = lapack, ptf77blas, ptcblas, atlas
  4. 設定内容の確認
    $python setup.py config
  5. numpyのbuild&install
    $python setup.py
    $sudo python setup.py install
    buildしたnumpy/coreに_dotblas.soができていてlddでlibatlas.so等にリンクされていることを確認してください。
  6. 別のディレクトリでnumpy.test()を実行して確認。

3でお気づきたと思いますが、GotoBLAS2を無理やりATLASだとNumPyに思わせてbuildしています。
GotoBLAS2やCBLASの時にやっていた謎のリンク(libptcblas.so etc.)はこのだったのです。
試しに5000×5000の行列のnp.dotを試してみるとたしかに4 threadsで実行されていることが確認できます。爆速です!

SciPy

  1. SciPyのソースを公式サイトからダウンロード&解凍。
  2. scipy/lib/lapack/__init__.pyとscipy/linalg/lapack.pyを以下のように編集
    変更前

    from scipy.linalg import flapack
    from scipy.linalg import clapack
    _use_force_clapack = 1
    if hasattr(clapack,'empty_module'):
        clapack = flapack
        _use_force_clapack = 0
    elif hasattr(flapack,'empty_module'):
        flapack = clapack
    

    変更後

    from scipy.linalg import flapack
    clapack = flapack
    _use_force_clapack = 0
    
  3. SciPyをbuild&install
    $python setup.py build
    $sudo python setup.py install
  4. 他の ディレクトリでscipy.test()を実行して確認。
    * ERROR: Failure: ImportError (/usr/local/lib/python2.7/dist-packages/scipy/linalg/atlas_version.so: undefined symbol: ATL_buildinfo)
    * ERROR: Failure: ImportError (/usr/local/lib/python2.7/dist-packages/scipy/linalg/clapack.so: undefined symbol: clapack_sgesv)
    の2つのエラーは無視しても大丈夫です。

2の操作はGotoBLAS2を無理やりATLASだと騙したために必要な操作です。ATLASにはATLAS CLAPACKと呼ばれるラッパーが付属しており、scipyはそれへのpythonのラッパーclapack.soを作成します。
しかし、ここでのlibatlas.so(実際にはlibgoto2.so)やliblapack.soにはそれらがが含まれていないため、clapackを無効にする設定です。

それではGotoBLASで楽しいNumPYライフを!!

scipy.sparseで疎行列の行列積

scipyにはscipy.sparseという疎行列の生成を扱うパッケージとscipy.sparse.linalgという疎行列の線形代数を扱うパッケージが存在する。しかし、この2つのリファレンスをいくら読んでも粗行列の行列積については触れていないので、公式ドキュメントと以下のスレッドを元に補足してみた。
[SciPy-User] Sparse matrices and dot product

sparse_matrixの扱いかた

scipy.sparseにはいくつかのフォーマットがあるが、基本的には生成時にlil_matrixを使用し、それをcsr_matrixに変換して計算するというのが効率的なようだ。

import scipy.sparse as sp

# generate 1000x1000 sparse matrix, whose components are initialized with 0
A_lil = sp.lil_matrix((1000,1000))

# do some thing to A_lil
do some thing to A_lil

# convert to csr_matrix
A_csr = A_lil.tocsr()

# do main calculation to A_csr
do some thing to A_csr

scipy.sparaseのsparsematrixはその存在自体が謎なnumpy.ndarrayのサブクラスの”matrix”ライクに操作できる。
すなわち”*”演算子やnp.dotを用いて行列積を計算する。

B_csr = A_csr.T * A_csr
B_csr2 = dot(A_csr.T,A_csr)

しかし、sparsematrixとndarrayに対してnp.dotを使うと変なことになる。

# this is invalid, C is 1D-ndarray of dtype=object
C = np.dot(A_csr.toarray(), A_csr)

この場合でも”*”演算子はちゃんと機能する。

# this is valid C2 is 2D-ndarray of dtype=np.float64
C2 = A_csr.toarray() * A_csr

そういったわけで、scikits.learn.util.extmathにはsafe_sparse_dotと言う関数が用意されているのでこれを使うのを推奨します。

def safe_sparse_dot(a, b, dense_output=False):
    """Dot product that handle the sparse matrix case correctly"""
    from scipy import sparse
    if sparse.issparse(a) or sparse.issparse(b):
        ret = a * b
        if dense_output and hasattr(ret, "toarray"):
            ret = ret.toarray()
        return ret
    else:
        return np.dot(a,b)

行列積の速度

以下のコードを走らせてみるとやはり行列積の速度は
csr_matrix > lil_matrix > ndarray
の順になった。というかcsr_matrixはかなり速い!もちろん行列が密になってくると速度の差はどんどん縮まっていきますのでご注意。

5000×5000成分のうち、90%が0の行列の行列積の結果

lil format needed 9.778 sec
csr format needed 5.387 sec
dense ndarray format needed 26.733 sec

error of lil = 1.34506066158e-22
error of csr = 1.34506066158e-22

テストコード

# -*- coding: utf-8 -*-
"""
Created on Tue Aug  2 11:04:57 2011

@author: lucidfrontier45
"""

from time import time
import numpy as np
import scipy.sparse as sp

def prepare_matrices(l=1000):
    # indexes and values of non-zero components
    print "generating indexes and values"
    ii = np.random.randint(0,l,(int(l*l/10),2))
    r = np.random.rand(int(l*l/10))

    # create a lil sparse matrix
    print "making lil matrix"
    A_lil = sp.lil_matrix((l,l))
    for n,i in enumerate(ii):
        A_lil[i] = r[n]
    A_lil.setdiag(np.ones(l))

    # convert to csr sparse matrix
    print "converting lil -> csr"
    A_csr = A_lil.tocsr()

    # convert sparse matrix to dense matrix
    print "converting lil -> dense ndarray"
    A_dense = A_lil.toarray()

    return A_lil, A_csr, A_dense

def tests_sparse_matmul(A_lil,A_csr,A_dense):
    """
    compare speed of matrix product
    """

    # mesure speed of matrix product for each format
    print "######################################"
    print "computing A_lil^T * A_lil"
    t1 = time()
    A2_lil = A_lil.T * A_lil
    t2 = time()
    print "lil format needed %8.3f sec" %(t2-t1)

    print "######################################"
    print "computing A_csr^T * A_csr"
    t1 = time()
    A2_csr = A_csr.T * A_csr
    t2 = time()
    print "csr format needed %8.3f sec" %(t2-t1)

    print "######################################"
    print "computing A_dense^T * A_dense"
    t1 = time()
    A2_dense = np.dot(A_dense.T,A_dense)
    t2 = time()
    print "dense ndarray format needed %8.3f sec" %(t2-t1)

    print "######################################"
    print "error of lil = ",((A2_lil.toarray()-A2_dense)**2).sum()
    print "error of csr = ",((A2_csr.toarray()-A2_dense)**2).sum()

if __name__ == "__main__":
    from sys import argv
    A_lil, A_csr, A_dense = prepare_matrices(int(argv[1]))
    tests_sparse_matmul(A_lil,A_csr,A_dense)

numpyでkernel kmeans

scikits.learnにKernel-Kmeansがなかったので実装してみました。
kernel関数の計算はscikits.learnに実装されているものをそのまま使用しました。

Kernel-Kmeansとはよう以下の式のようには特徴空間上でKmeansをやるわけです。

c_n = \mathrm{argmin}_k ||\phi(x_n) - \mu_k||^2

ここでx_n, c_n, \phi(\cdot), \mu_kはそれぞれn番目のサンプルの値、ラベル、特徴空間への写像関数、k番目のクラスターの特徴空間上の中心です。
この式を展開し、kernel関数\mathcal{K}(\cdot,\cdot)、k番目のクラスターの要素数N_kを使って整理すると最終的には以下のようになります。

c_n = \mathrm{argmin}_k \mathcal{K}(x_i,x_i) - \frac{1}{N_k}\sum_{c_m=k}\mathcal{K}(x_n,x_m) + \frac{1}{N_k^2} \sum_{c_m,c_{m'}=k}\mathcal{K}(x_m,x_{m'})

ちなみに右辺の第一項\mathcal{K}(x_i,x_i)は常に一定なので計算しなくてもいいです。

この計算を収束するまで繰り返すわけですが、Pythonで実装する際のポイントは maskを使うことです。例えば

from numpy.random import randn

x =  randn(1000)
mask = x > 0.5

としますとx[mask]はxのうち、0.5以上の成分だけになりますし、x[mask].sum()とすればそれらの和になります。
これを利用して以下のように実装しました。80-84行でmaskを利用しています。

import numpy as np
from numpy.random import randint
from scikits.learn.metrics.pairwise \
    import linear_kernel, polynomial_kernel, rbf_kernel

class KernelKMeans():
    def __init__(self,K,kernel="rbf",**args):

        # number of cluster
        self.K = K

        # kernel type
        self.kernel = kernel

        # sigma parameter for rbf kernel
        if "sigma" in args:
            self.sigma = args["sigma"]
        else :
            self.sigma = 1.0

        # degree parameter for polynomial kernel
        if "degree" in args:
            self.degree = args["degree"]
        else :
            self.degree = 3

    def _get_kernel(self, X, Y=None):
        """
        Calculate Gram matrix
        input
            - X [ndarray, shape (N,D)] : data matrix
            - Y [optional ndarray,shape (N2,D)] : reference data matrix
        output
            - [ndarray shape(N,N) or (N,N2)] : Gram matrix
        """
        if Y is None:
            Y = X

        if self.kernel == "precomputed":
            return X
        elif self.kernel == "rbf":
            return rbf_kernel(X, Y, self.sigma)
        elif self.kernel == "poly":
            return polynomial_kernel(X, Y, self.degree)
        elif self.kernel == "linear":
            return linear_kernel(X, Y)
        else:
            raise ValueError("%s is not a valid kernel. Valid kernels are: "
                             "rbf, poly, linear and precomputed."
                             % self.kernel)

    def fit(self,X,maxiter=100,threshold=1.0e-4,init=True):
        """
        Fit parameters
        input
            - X [ndarray, shape(n_samples,ndim)] : input data matrix
            - maxiter [int] : maximum iteration number
            - threshold [float] : threshold for convergence
            - init [bool] : flag for initialize parameters
                set it False when you want to resume
        """
        self.X_train = X.copy()
        n_samples, n_dim = X.shape
        K = self.K
        if init:
            self.codes = randint(0,K,n_samples)
        G = self._get_kernel(X)
        dists = np.empty((n_samples,K))
        total_dist = 1.0e100

        # main loop
        for i in xrange(maxiter):

            N = np.bincount(self.codes)
            if not N.all():
                raise ValueError, "at leas one of the cluster is empty"

            for k in xrange(K):

                # obtain 'mask' such that self.codes[mask] = k
                mask = (self.codes == k)

                # calculate distance in feture space by Gram matrix
                dists[:,k] = -G[:,mask].sum(1)/N[k] + G[mask,mask].sum()/N[k]**2

            # assign data to its nearest cluster
            self.codes = dists.argmin(1)

            # calculate sum of distances of data to the
            #   corresponding cluster center
            new_total_dist = dists.min(1).sum()

            # check convergence
            d_total_dist = total_dist - new_total_dist
            if d_total_dist < threshold:
                print "%5dth iter %8.3f < %8.3f, converged" \
                    %(i,d_total_dist, threshold)
                break
            print "%5dth iter %8.3f"%(i,d_total_dist)

            total_dist = new_total_dist

    def decode(self,Y):
        """
        Assign each dataum to the nearest cluster
        input
            - Y [ndarray, shape(n_samples,ndim)] : input data matrix
        output
            - codes [ndarray, shape(n_sample)] : array of indexes of cluster
                to which each datum belongs
            - dists [ndarray, shape(n_sample,K)] : array of distances in
                feature space
        """
        n_samples, n_dim = Y.shape
        K = self.K
        G = self._get_kernel(Y,self.X_train)
        dists = np.empty((n_samples,K))
        N = np.bincount(self.codes)
        for k in xrange(K):
            mask = (self.codes == k)
            dists[:,k] = -G[:,mask].sum(1)/N[k] + G[mask,mask].sum()/N[k]**2
            codes = dists.argmin(1)
        return codes, dists

次のテストコードを最後に追加して実験してみました。

from numpy.random import rand
def test_data(n=1000):
    x = rand(n,2)*2.0 -1.0
    mask1 = np.sum(x**2,1) < 0.3
    mask2 = np.sum(x**2,1) > 0.7
    return np.r_[x[mask1],x[mask2]]

if __name__ == "__main__":
    import pylab
    X = test_data()
    cl = KernelKMeans(2,kernel="rbf",sigma=0.20)
    cl.fit(X)
    codes,dists = cl.decode(X)
    for k in range(2):
        mask = (codes == k)
        pylab.plot(X[mask,0],X[mask,1],"o")
    pylab.show()

kernel_kmeans

微妙にうまくいっていませんね…

多次元正規分布の発生

[多次元標準正規乱数]

numpyには乱数を扱うパッケージnumpy.randomがある。この中にあるnumpy.random.randnは(多次元)標準正規乱数\mathcal{N}(0,\mathbf{I}_d)を生成する。(dは次元)

# import packages
import numpy as np
from matplotlib import pyplot as plt

# generate 10,000 random numbers who are drawn from 2d standard normal distribution
X = np.randn(10000,2)

# its covariance matrix is almost identity
np.cov(X.T)

# see the scatter plot
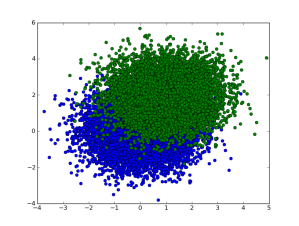
plt.plot(X[:,0],X[:,1])
plt.show()

[多次元正規乱数]

では各次元が相関し、平均が0ではない一般の多次元正規乱数\mathcal{N}(\mu,\Sigma)はどうするか?randnそのままではできないが、次のように生成できる。

まず,\mathbf{X}を上の例で示したように\mathcal{N}(0,\mathbf{I}_d)からのNつのサンプルとする。

\mathbf{X}_n \sim \mathcal{N}(0,\mathbf{I}_d)

平均を0から\muに移動するのは簡単だ。

# let mu = (1.0,2.0)
nu = np.array([1.0,2.0])

# translate X by mu and store it in Y
Y = X + mu

# see the scatter
plotplt.plot(Y[:,0],Y[:,1])
plt.show()

分散はいわゆるコレスキー法を使えばいい。これは\mathbf{X}の線形変換

\mathbf{Y}_n = \mathbf{A}\mathbf{X}_n

の共分散が\mathbf{A}\mathbf{A}^Tになるということを利用する。すなわち

\mathbf{A}\mathbf{A}^T = \Sigma

なる\mathbf{A}を探すというわけであるが、これはまさにCholesky分解そのままである。

# import cholesky from scipy.linalg
from scipy.linalg import cholesky

# set Sigma, must be a symmetric matrix
Sigma = array([[3.0,0.5],[0.5,1.0]])

# decompose Sigma to AA^T
A = cholesky(Sigma)

# translate X by A and store in Y
# note X has shape (N,D) and A (D,D) and must multiply in order of dot(X,A)
Y = np.dot(X,A)

# see the scatter
plotplt.plot(Y[:,0],Y[:,1])
plt.show()

以上をまとめると、\mathcal{N}(\mu,\Sigma)は次のようにして生成できる。

import numpy as np
from scipy.linalg import cholesky

def randn_multivariate(mu,Sigma,n=1):
    X = np.random.randn(n,len(mu))
    A = cholesky(Sigma)
    Y = np.dot(X,A) + mu
    return Y

長々と書きましたが、実はnumpyも実装されていました…(ちゃんと調べろよ→昔の自分)

multivariate_normal(mean, cov, [m, n, …]) -> random values

というわけで numpy.random.multivariate_normalを使ってください。

Starting Numerical Computation with Python!

ここではPythonで数値計算の環境を整える際にやるべきことをまとめておきました。
詳ししい情報はhttp://www.scipy.org/Installing_SciPyなどを参照のこと。

また、Pythonを使った数値計算のチュートリアルとしてはEuroScipy Tutorial Team謹製のものがあります。
Python Scientific Lecture Notes
その日本語訳

[Windows]

1. Pythonをインストール

公式HP日本語の公式HPからver 2.x系統のインストーラーをダウンロードし、ダブルクリックして指示に従ってインストールしてください。
ver 3.x以降は2.xと互換性がなく、numpy関連も怪しいので必ず2.x系統にしてください。

2. setuptools,numpy,scipy,pyreadline,ipython,matplotlibのインストール

インストールしたPythonと対応するバーションのインストーラをそれぞれダウンロードし、インストールしてください。

3. noseのインストールとnumpy,scipyのテスト

numpyのテストのためにnoseと言うパッケージをインストールします。python関連はデフォルトでC:\Python2x\にインストールされているはずです。この中にScriptsというディレクトリがありますのでこれをOSのPATHに登録してください。コマンドプロンプトを開き、

$ easy_install nose

と打ちますとPyPIを検索して最新版のnoseがインストールされます。次にwindowsメニューの”すべてのプログラム”からipythonを探して起動してください。立ち上がりましたら

import numpy
import scipy
numpy.test()
scipy.test()

これでErrorと出てこなければとりあえずインストールは成功です。

4. GCCコンパイラーのインストール (optional)

いくつかのPythonのパッケージ(scikits.learnやPyMCなど)はCやFortranのソースコードを含んでいるのでそれらを入れるためにはコンパイラーをインストールする必要があります。
Windows環境ではMinGWをインストールするとこれらのコンパイラを手に入れることができます。

5. pythonxyによる一括インストール

1-3は実はpythonxyをインストールする際にすべて一括で入れることができるのでとても楽です。
ただし、他にも大量にパッケージがインストールされるので注意してください。

[Ubuntu]

Ubuntuの場合は基本的にはすべてレポジトリからaptをつかってインストールすることができます。
以下のパッケージをsynapticや端末からapt-get,aptitude等でインストールしてください。

  • gcc
  • build-essential
  • gfortran
  • libblas-dev
  • liblapack-dev
  • python
  • python-dev
  • python-setuptools
  • python-numpy
  • python-scipy
  • python-matplotlib
  • python-nose
  • ipython

[Mac OS]

基本的にはmacportsを使ってUbuntuと同様にパッケージ群をインストールすればいいと思います。注意点としては、パッケージ名がpy2x-numpy (xは6,7などのver) のようになっている点です。
また、Windowsと同様にインストーラーも公式URLで公開しているようですので対応するverのものをそれを使ってインストールすることもできます。
以下のURLにも詳しい情報が有りますので参考にしてください。
How-to install Matplotlib and SciPy using Macports

pythonxyと同じようにMac OSにはSciPy Superpackという一括インストーラーも有りますので始めての方はこちらを利用したほうが簡単かと思います。ただし、numpyのverが2011年7月末で安定版は1.61に対し、superpackにはテスト版(?)の2.0がはいっているなど、先進的すぎる気もするのでその点はご注意ください。

[Source CodeからBuildする]

Ubuntu等のレポジトリに入っているものは常に最新版とは限らず、新しいものを使いたい場合やサーバー等にインストール時はソースコードbuildしなければならないこともあります。
そういった場合は公式HPのInstallセクションを見てください。